|
CPAC 13: Isolate an individual species from a mixed culture of bacteria using streak plating Safety Method Day 1:
Day 2:
Safety
0 Comments
Investigate the rate of growth of bacteria in liquid culture Tim Control Variable of the experiment: In this experiment, variables that needs to be controlled are the temperature throughout the investigation. This is because at a high temperature, the enzymes of the E. Coli bacteria might denature as the active sites will change shape and no longer fit the substrate. Or, if the temperature is too cold, the enzymes will stop working. In both conditions, it will affect the rate of growth of the E. Coli in liquid culture. We controlled this by placing all the repeats in room temperature throughout the experiment to ensure a fair test, so that the results will be more accurate. To ensure that all the bacteria that are growing in the liquid culture gets the nutrients from it, a magnet is placed in the flask of the liquid culture and the flask is placed on a magnet spinning machine that ensures the solution to be stirred nonstop throughout the experiment to make the results more accurate. Risks To minimize the risk of E. Coli spreading, certain aseptic techniques are required.
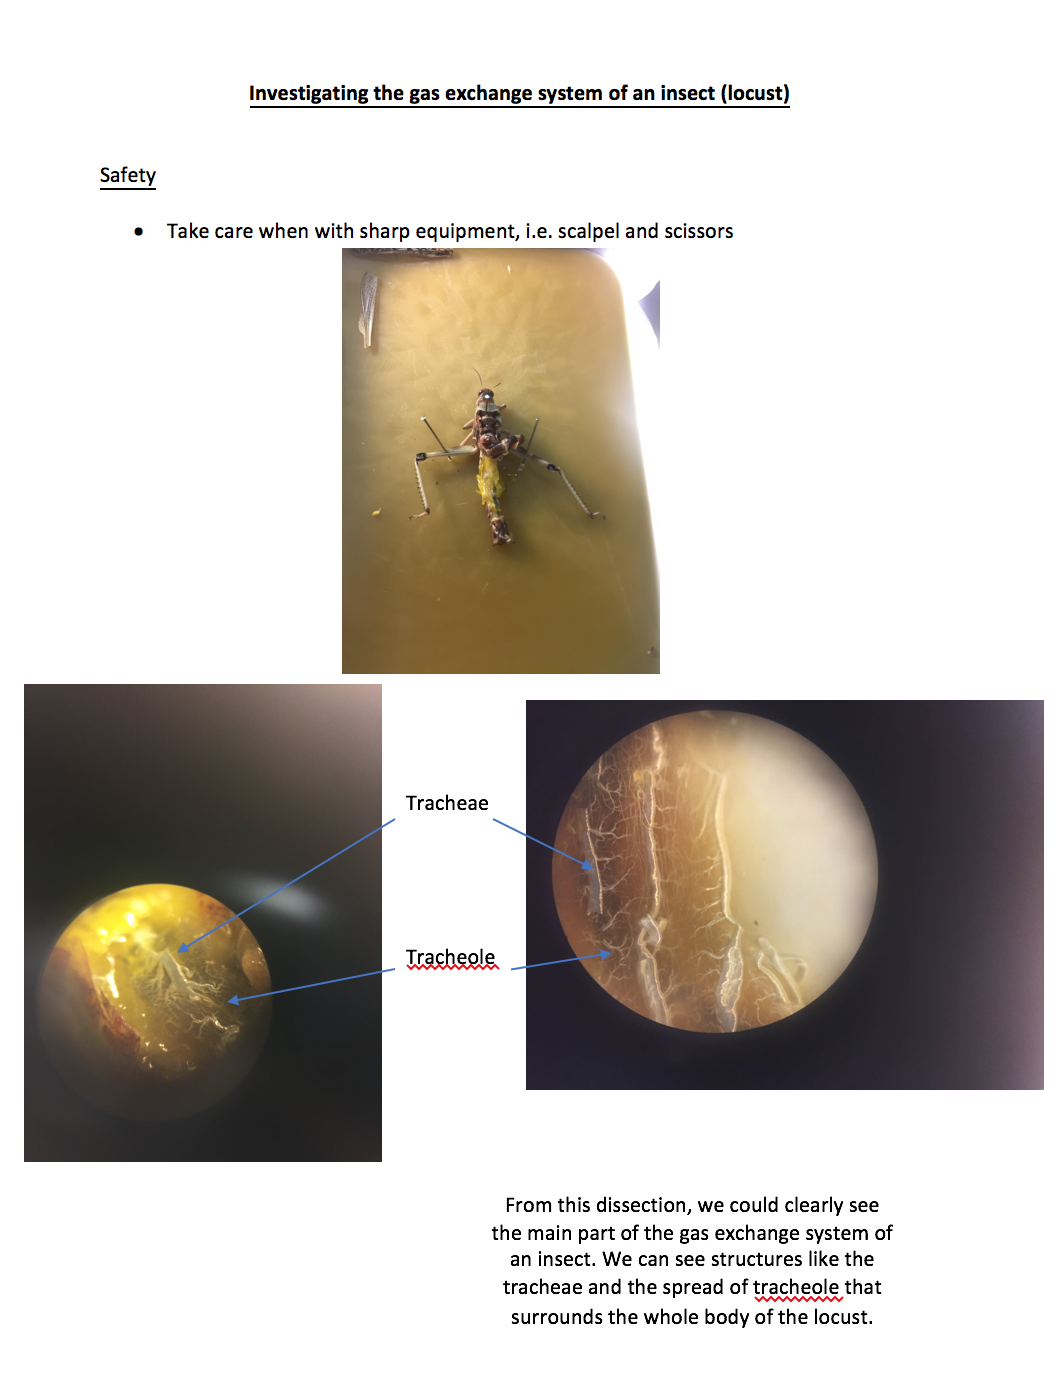
It is found that E. Coli is still evolving to be drug resistant and that it can be found in our own diet. As an article from Oxford Academic says; “They (The research team) analysed 287 E. coli isolates recovered from meats for a large number of virulence factors and resistance markers. They showed that drug-resistant isolates had characteristics very similar to those of susceptible isolates recovered from the same types of meat but quite different from those of isolates found in other types of meat. Put another way, the drug-resistant isolates found on retail poultry products are very similar to susceptible isolates found on retail poultry products, compared with drug-resistant or susceptible isolates of E. coli recovered from pork or beef.”(1) (1) Peter Collignon. 2009. Resistant Escherichia coli— We Are What We Eat. Oxford Academics. Clin Infect Dis (2009) 49 (2): 202-204. 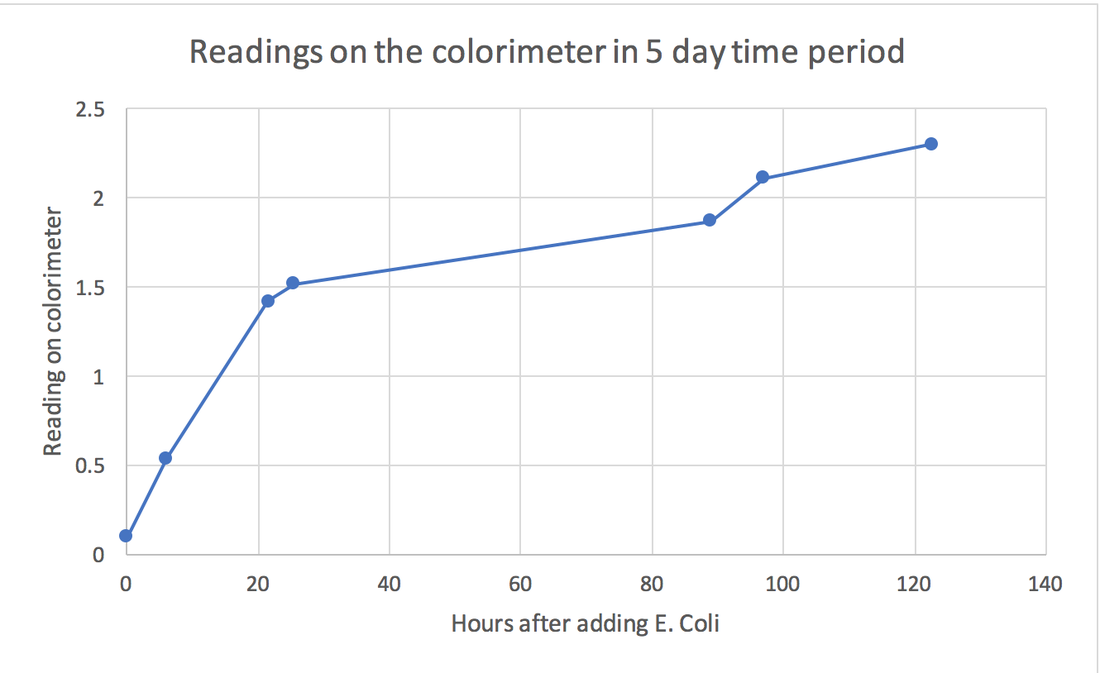 In this dissection, we have dissected out the gill arch and have measured out the number of gill filaments on a 1 cm stretch, the length of a gill arch and the length of a single filament to calculate the total surface area of gas exchange for the salmon we have dissected. Number of gill filaments on a 1 cm stretch = 22 cm Length of gill arch = 9 cm Length of a single filament = 2.2 cm Total surface area = 22 x 2.2 x 9 x 2 x 8 = 6969.6 cm2 CPAC 3 Safety
Method
As shown in the photo above, we cannot see any cells about to undergo or undergoing mitosis, as the nucleus are still intact and none are showing signs of being pulled apart, hence the mitotic index, which is (number of cells undergoing mistosis / number cells under the view of microscope) x 100%, for our experiment is zero. Investigating plant water relations Introduction Osmosis is the process where water passes through a partially permeable membrane from a higher water potential to a lower water potential. In a cell, osmosis sometimes can cause plasmolysis (when the plasma membrane starts to separate from the cell wall). In this investigation, we are going to determine how the osmotic potential and the water potential of plant epidermal cells is effected by different salt concentration. Hypothesis I predict that at higher salt concentration, more cells are going to be plasmolysed, because at higher salt concentration, the water potential surrounding the onion cells are lower, and so more water within the cell is going to go out of the cell through osmosis, hence easier for plasmolysis to happen. Variable Independent Variable: Salt concentration Dependent Variable: Number of cells plasmolysed. Controlled Variables:
Method
As shown from the general trend in the graph, it overall supports my hypothesis that the higher the salt concentration, the more onion cells would be plasmolysed. This is because water will go to a lower water potential from a higher water potential and so when there is a lower water potential (salt concentration surround the cells), the water will go out of the onion cells, hence the plasma membrane of the cell detaches further away from the cell wall, causing the cell to be plasmolysed. However, it should be expected a smoother curve, as there is a sharp change in the percentage of cells plasmolysed between the salt concentrations of 0.5 and 0.7 mol dm-3. This could be because of some variables were not controlled properly, causing the results to be slightly inaccurate. Evaluation Errors
Improvement
CPAC 2 Method
Results I can clearly see the organelles found in the rat’s liver as shown below with comparison to an image taken by an electron microscope. The effect of enzyme concentration on the rate of enzyme controlled reaction Introduction Chymosin is an enzyme that has a function of breaking the peptide bonds in a protein called casein, which is found in milk. The product of this reaction is an insoluble polypeptide that forms a white solid curd. We are going to investigate how different enzyme concentration is going to effect the time taken for the product to form. Hypothesis I think that the higher the concentration of chymosin enzyme, the faster the rate of product formed. This is because the higher the concentration, the more enzyme there is in a fixed volume, meaning there would be more active sites available for substrates to react with, hence increasing successfulness of each collision. When more and more enzyme substrate complex forms, there will be less active site left for a reaction to occur, therefore overtime the rate of product formed is going to decrease. Variables Independent Variable: Enzyme (Chymosin) Concentration Dependent Variable: Time taken for milk to turn to curd in seconds, then we take the rate of the reaction by dividing the time taken by 1. Controlled Variables:
Method
The trend of the graph is linear, where the concentration of chymosin is proportional to the average time taken for the ‘curd’ to appear. Where increasing the concentration decreases the average time taken. The result is reliable, as 6 repeats were done in each concentration and the average is taken for comparison. There does not seem to have any anomalies in the results as all the points follow a sensible trend, shown by the straight line in the graph. As the error bars shown, for the first 2 concentrations of chymosin, there must be anomalies as the standard deviation overlaps each other, which suggests that the data is inaccurate. Increasing the enzyme concentration increases the rate of reaction, because this will mean there will be more enzyme molecules to collide with the substrate molecules (casein), hence increases the chance of successful collision between the both, making it more likely to react with each other, so products will be formed sooner. This is shown by the data of the rate slowly increasing, e.g. from 20% with a rate of 0.0033 to 0.0042 at 40%, then to 0.0063 at 60%. However, we would expect a curve downwards, where the average time taken would no longer decrease as the concentration of chymosin increases, this is because at that point, there would be too many enzyme molecules, providing more than enough active sites for the substrate molecules to react with, and therefore increasing the enzyme concentration would not increase the rate of reaction any further. At this point only increasing the substrate concentration will increase the rate of reaction, but that will also increase the volume of products formed. This was not seen in the graph as the enzyme concentration for chymosin chosen was not high enough for this situation to happen. Evaluation and Conclusion Error
Significance of the error to the results of the experiment
Improvement
The general trend of the graph is that the average time taken for us to see the ‘curd’ slowly decreases as we increase the concentration of chymosin, supporting my hypothesis. The experiment is reliable as there are 6 repeats of each concentration. However, as shown by the error bar in the graph above, we can see that at the concentration of 40% of chymosin, the error bar indicating the standard deviation is much larger than the other data, meaning that the level of inaccuracy of the set of data is larger than other concentration of chymosin. This may be due to some controlled variables not controlled properly and as wells as some procedures not accurately performed, henceforth decreasing the validity of the experiment. Further Work In this experiment, we are going to determine the effect of different temperatures on the rate of reaction of the enzyme chymosin in reacting with the substrate casein, an enzyme that is usually found in milk. We are going the repeat the experiment at least 5 times with 5 different temperatures of 10, 20, 30, 40, 50 degrees Celsius. We are going the measure the time taken for us to see the first appearance of curd in the milk and find the rate by dividing the time taken by one and generate a graph of temperature against rate of reaction. To measure the temperature, we are going to use a water bath to more accurately adjust the temperature of the milk. Also we are going to use a stop watch to measure the time taken in each experiment. Controlled variables that have to be kept constant throughout the experiment is the concentration of both the substrate and the enzyme, and the same type of milk to ensure the pH level is kept the same. Investigating the effect of temperature on beetroot membrane permeability Introduction A cell membrane consists of a phospholipid bilayer, and the lipid part of the membrane is called polar lipids. With water or aqueous solutions on each side, the phospholipid molecules form a bilayer with their hydrophilic heads pointing into the water while the hydrophobic tails stay protected in the middle. This is known as a unit membrane. Factors that could affect membrane permeability is temperature and the surface area of the beetroot. In this investigation, we would compare the effect of different temperature that affects the membrane permeability of beetroots. Aim To determine the effect of temperature of water on the membrane permeability of beetroots by comparing the percentage transmission of water soluble red pigment called betalain, through a colorimeter. Hypothesis I think that the higher the temperature, the faster the rate of diffusion of betalain to water. This is because at higher temperature, the molecules of betalain have higher kinetic energy, and so it will diffuse further and faster. Variable Independent Variable: Temperature Dependent Variable: Percentage transmission of water Controlled Variables: Surface area of each beetroot Safety
From these results, the higher the temperature, the less percentage transmission is recorded by the colorimeter, meaning that at higher temperatures, the more concentrated of betalain is present in the test tube. And in the opposite, at lower temperature, a higher percentage transmission is recorded as the liquid in the test tube contains less concentrated solution of betalain. Therefore, the results generally support my hypothesis, where at 0 oC, the average percentage transmission is 80.5%, where most of the light in the colorimeter can pass through the liquid. However, at 60 oC the average percentage transmission is 32%, showing that most of the light is blocked by the concentrated solution of betalain in the test tube. This indicates that at lower temperature, less betalain is diffused through from the beetroot to the water surrounding it and hence the percentage transmission is very high, and vice versa. As shown in the table above, the percentage transmission data at 60oC does not follow the general pattern of the other data of a smooth decrease. These may be due to some control variables we are not able to control well and also some procedures were not accurately performed. Hence, the results might not be too valid. In addition, the amount of repeats of the experiment was fewer than normal standards, and hence the results might not be reliable. Evaluation Errors
Improve
|
 RSS Feed
